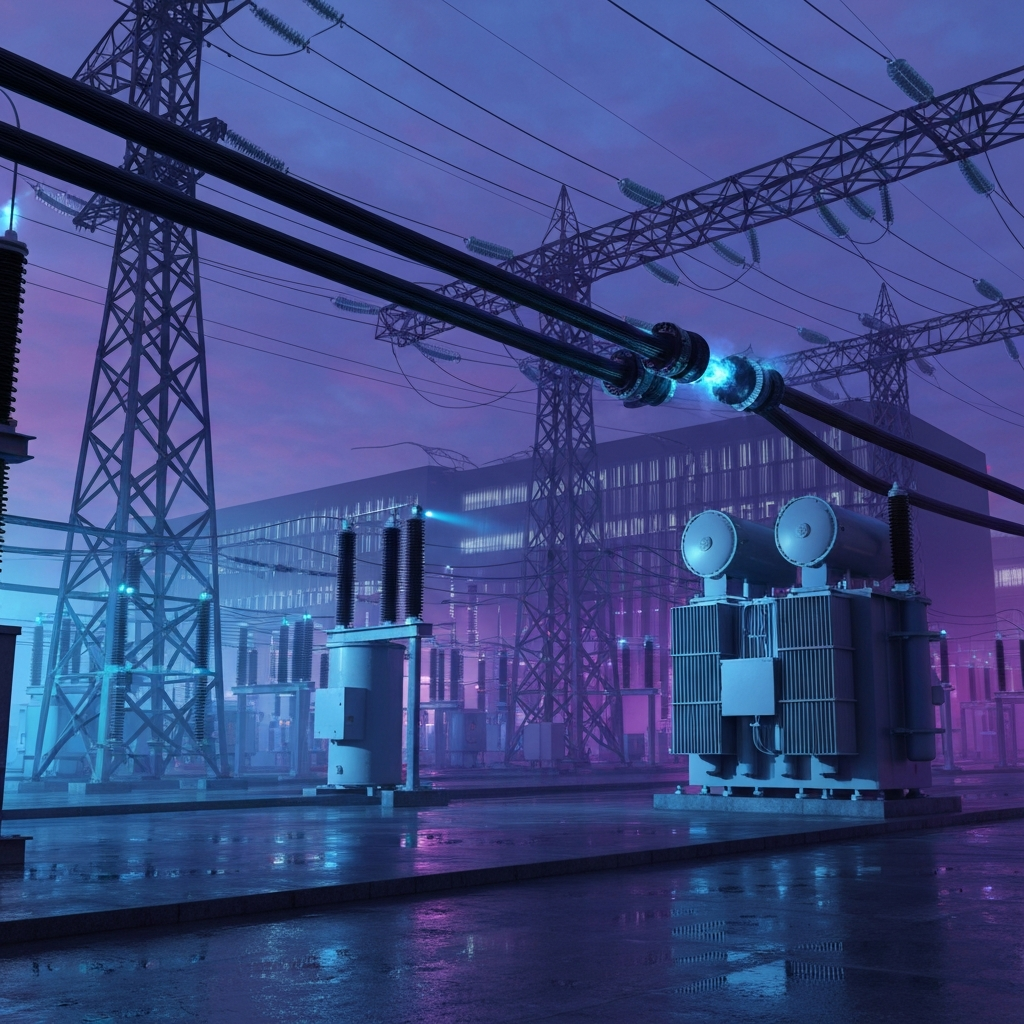
Seventeen AI data center projects now exceed 900 megawatts each. Back in 2023, only three did. That is nearly a 6x surge in the mega-project pipeline in about two years.
And roughly one in five of those giant projects have already stalled. Not because of GPUs. Not because of money. Because they cannot get power.
A single 900MW site rivals the electrical draw of a mid-sized city. The World Economic Forum now calls grid connectivity the "strategic bottleneck" for AI, writing that access to the grid, "rather than chips, capital, or algorithms," is the binding constraint. I think most builders still have not internalized what that means for their timeline.
The Time-to-Power Trap
Here is the framework that explains every stalled megawatt: The Time-to-Power Trap.
Four numbers that show the constraint has moved off the chip and onto the wire.
You can pour concrete for a data center in 18 to 24 months. You can wire in a grid connection in 4 to 5 years. You can string new long-distance transmission in 7 to 12 years. Those three clocks run at wildly different speeds, and the slowest one wins.
McKinsey now says "time to power" is the single biggest factor operators weigh when siting a facility. It beats land. It beats labor. It even beats hardware. In Northern Virginia, the world's largest data center market, electricity wait times have stretched up to 7 years, according to CSIS.
So the trap is simple. Builders optimize the fast clock, construction, and ignore the slow clock, interconnection. Then they stand next to a finished building with no juice. The trap is not that power is scarce. It is that power is scarce on a completely different timeline than everything else.
The System Is Queuing, Not Producing
When one part of a system runs 5x slower than the rest, the whole system inherits that speed. That is the core lesson here, and it is not a power problem. It is a throughput problem.
Look at the interconnection queue like a factory line with one jammed station. Lawrence Berkeley National Laboratory data, summarized by QZ, shows only 13% of capacity that applied to connect between 2000 and 2019 had reached commercial operation by the end of 2024. Seventy-seven percent was withdrawn. Fewer than one in five queued projects ever ship.
Now stack the AI load on top of that jam. Over 460 GW of generation and storage sat in U.S. queues by late 2025, nearly twice the entire existing U.S. power fleet, per QZ. That is not a shortage of electricity. It is a shortage of processing capacity in the queue itself.
The equipment layer tells the same story. Wood Mackenzie data shows large power transformer lead times hit roughly 128 weeks, about 2.5 years, in 2025. Pre-2020, those same transformers shipped in 24 to 30 months. Electrical gear is under 10% of total data center capex, but TechInvestments notes it has become "100% of the bottleneck."
That last line is the whole systems lesson. The cheapest input became the constraint. When you scale a system, the binding constraint always migrates to the slowest, least glamorous node. Right now that node is a copper-and-steel transformer with a two-and-a-half-year wait.
So what do the operators who solve this actually do? They stop treating power as a procurement checkbox and start treating it as the primary system input. Microsoft and Amazon are bypassing public grids entirely, investing in dedicated nuclear and gas, per Forbes. They moved the constraint off the shared queue and onto a private one they control.
That is the right systems move. You cannot speed up the queue, so you route around it. Whether smaller builders can copy this without hyperscaler capital is unclear, and I suspect most cannot. The data is mixed on how much private generation actually helps when local transmission is still the choke point.
2031. Pull the camera back to a five-year arc. Morgan Stanley projects U.S. data center demand could hit 74 GW by 2028, with a shortfall of about 49 GW in deliverable power. That means roughly 40% of the demand has no clear path to a plug.
This is a counterpositioning moment. For a decade, the asymmetric advantage in AI was compute and capital. Whoever raised the most and bought the most chips won. That flywheel is spinning down.
The new flywheel is deliverable, firm power at the right place on the right timeline. The advantage now compounds for whoever controls generation rights and a good queue position, not whoever has the fanciest cluster. Deloitte projections cited in market intelligence show U.S. AI data center demand rising from about 4 GW in 2025 to roughly 123 GW by 2035, a 30x jump in a decade.
Here is the contrast that matters. Amateurs are still asking "how many GPUs can I buy." Leaders are asking "where can I get 900 megawatts permitted and delivered before my competitors." Only megawatts are real. The rest is a spreadsheet.
There is real stranded-asset risk on both sides of this bet. If utilities overbuild for demand that never shows, consumers eat the cost. If they underbuild, the whole AI expansion throttles. My read is that the winners of 2031 are being decided today in interconnection queues, not in chip orders, and almost nobody is watching that scoreboard.
Three signals inside the same shift
Construction runs fast, interconnection runs slow.
You can pour concrete in 18 to 24 months but wire a grid connection in 4 to 5 years and string transmission in 7 to 12. In Northern Virginia, electricity wait times have stretched up to 7 years per CSIS. The slowest clock sets the timeline.
It is a throughput problem, not a shortage.
Over 460 GW of generation and storage sat in U.S. queues by late 2025, nearly twice the existing fleet. Yet only 13% of 2000-2019 applicants had reached operation by 2024. The queue itself is the jammed station.
The flywheel moved from compute to firm power.
Microsoft and Amazon are bypassing public grids for dedicated nuclear and gas per Forbes, routing around the queue onto private capacity. The winners of 2031 are being decided in interconnection queues today, not in chip orders.
What to Build This Weekend
You do not need a substation to learn this. You need one small dashboard that tracks a real constraint. Build a Time-to-Power tracker for any market you care about.
First, pick a tool. Softr is a no-code platform for building internal software like dashboards and trackers, and it works well for this. If you want to describe the whole app in plain English instead, Lumi.new turns a text prompt into a functional web application, and Blink.new does the same for full-stack apps.
Then, set up your data. Create a simple table with four columns: project name, announced megawatts, construction start date, and estimated grid connection date. Add a fifth calculated column for the gap between those two dates. That gap is your Time-to-Power number, the single metric that predicts a stall.
Next, feed it real projects. Start with the public ones, the Wisconsin sites needing a combined 3.9 GW with connection delays over three years, or any hyperscaler build in your region. You are learning to read the slow clock instead of the fast one.
Expect it to break. Your first version will have messy dates and missing data, and that is fine. Ship it ugly, then fix one column at a time.
One more thing. If you keep getting distracted while building, LockIn MCP lets you tell your AI agent to block distracting sites while you work. Get your reps in this weekend. Build one tiny thing, learn what the queue really looks like, and you will understand this shift better than most people writing billion-dollar checks.
Build a Time-to-Power tracker for a market you care about.
- Pick a no-code tool. Use Softr to build the dashboard, or describe the whole app in plain English with Lumi.new or Blink.new for a full-stack build.
- Set up the table. Create columns for project name, announced megawatts, construction start date, and estimated grid connection date, then add a fifth calculated column for the gap. That gap is your Time-to-Power number.
- Feed it real projects and ship it ugly. Start with public builds like the Wisconsin sites needing a combined 3.9 GW with connection delays over three years. Expect messy data, then fix one column at a time.
Only megawatts are real. The rest is a spreadsheet.
When you scale a system, the binding constraint migrates to the slowest, least glamorous node, and right now that is a copper-and-steel transformer with a two-and-a-half-year wait. Electrical gear is under 10% of data center capex but has become 100% of the bottleneck. Amateurs are still asking how many GPUs they can buy while leaders ask where they can get 900MW permitted and delivered first. Deloitte projects U.S. AI data center demand rising 30x to roughly 123 GW by 2035, and almost nobody is watching the queue that decides who gets there. Build the tracker and you will read the slow clock better than people writing billion-dollar checks.