- SPECIMEN
Chrome DevTools MCP
- FILED AS
MCP server that lets coding agents drive and profile a live Chrome session
- INTAKE DATE
- 2026-08-03
- CLASS
- Coding
- METHOD
- 1 page scraped, 3 search passes, 12 community sources
Koda Score = weighted blend: capability 35, ease 20, value 25, momentum 20.
Your agent can now take two heap snapshots, diff them, and name the object that is eating the tab, without you ever opening a profiler.
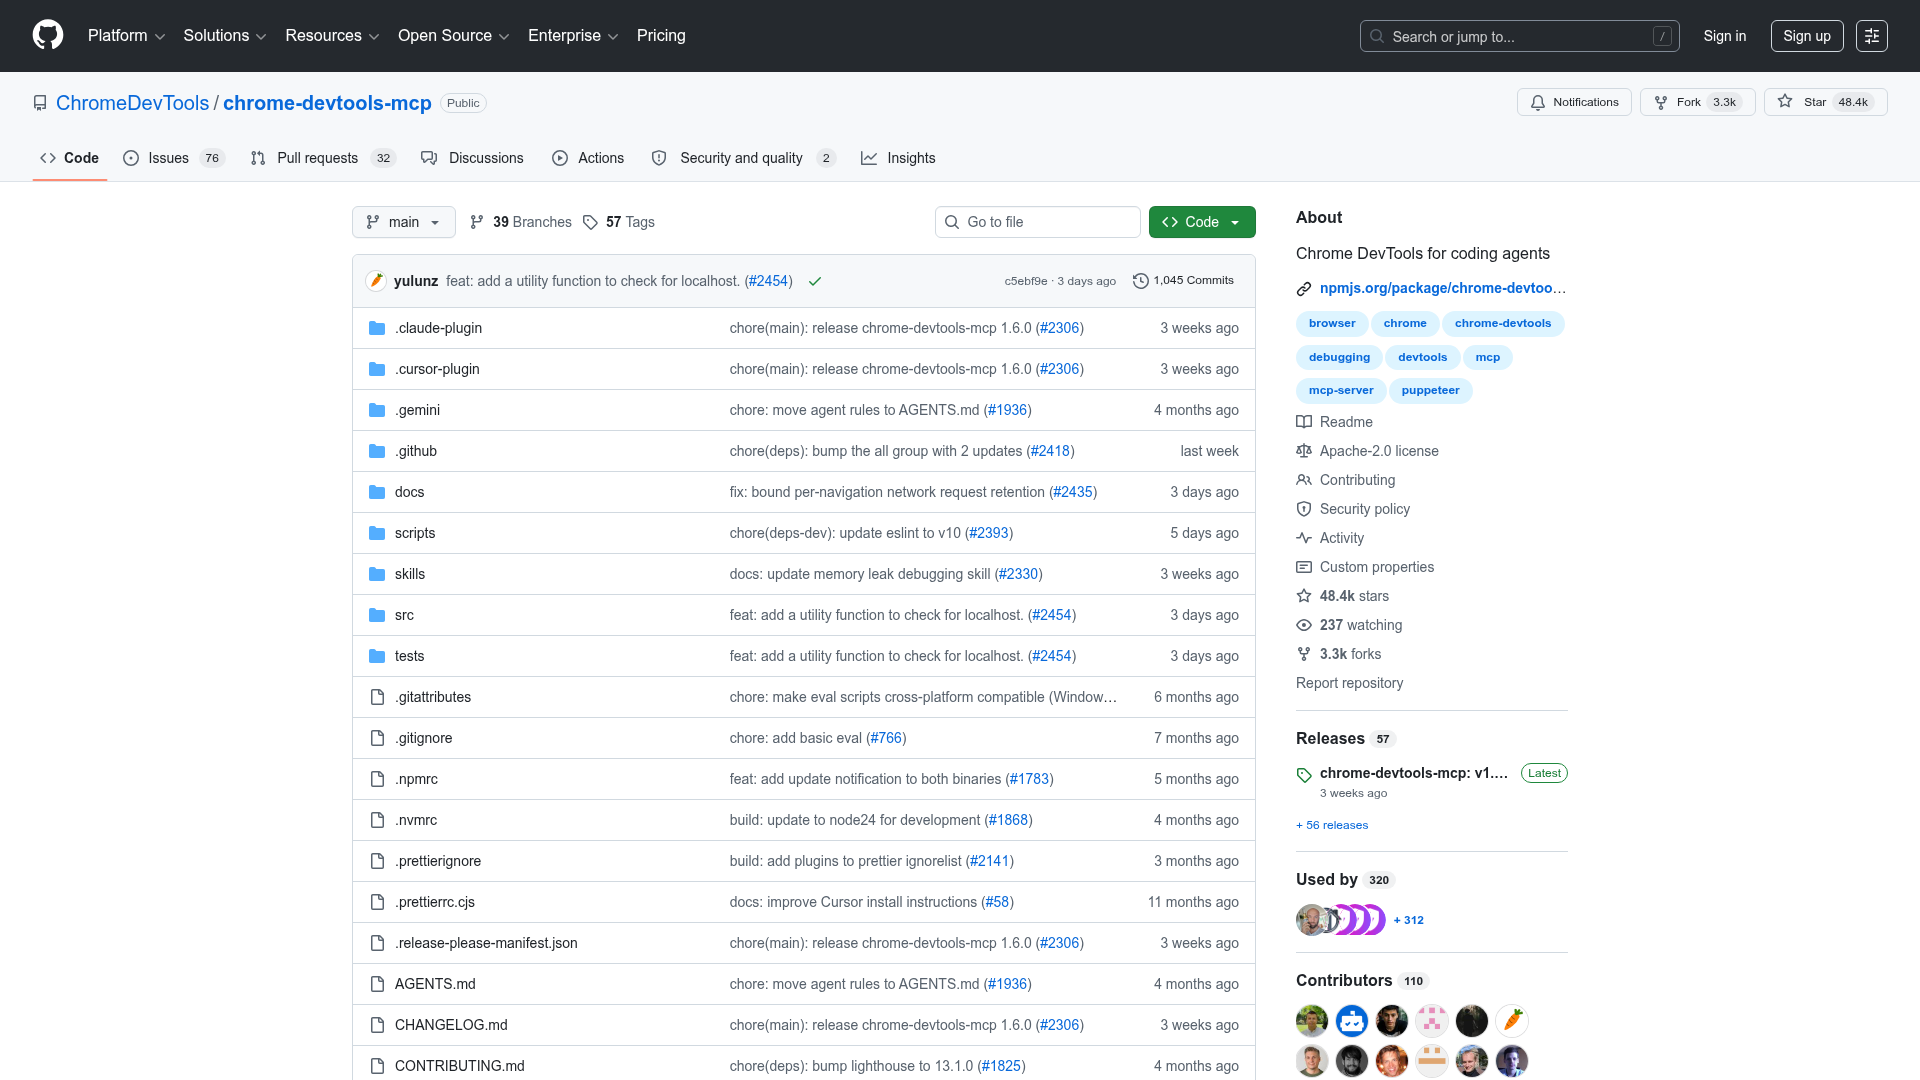
Captured: github.com/ChromeDevTools/chrome-devtools-mcp, the project's home, not a product screen.
This is for developers already running Claude Code, Codex, or another MCP client who are tired of agents guessing about runtime behavior from source code alone. The 1.5.0 memory tooling, extended in 1.6.0 with object counts, total sizes, and snapshot filtering, turns a vague slowdown report into a named retainer, which is the single hardest handoff to automate. Adopt it if you own web performance; it is free, it is Google's own, and the alternative is you in a profiler tab.
What it actually does.
Heap snapshot capture and diff
An agent can take snapshots around a suspected leak and compare the two to find what grew.
Snapshot details with counts and sizes
The 1.6.0 release prints object counts and total sizes in get_heapsnapshot_details so the numbers are readable to a model.
Aggregate filtering
Filtering on heap snapshot aggregates keeps the output narrow enough to reason about instead of dumping the whole graph.
Live browser inspection
Agents can read console, network, and performance data from a real page rather than inferring behavior from source.
Performance insights and Lighthouse
Performance analysis is built in, with Lighthouse bumped to 13.4.0 in the 1.6.0 release.
Reliable browser automation
Puppeteer-backed control means the agent can navigate and act on the page, not just observe it.
Existing session reuse
Google's launch posts highlight debugging inside an already authenticated Chrome session, so logged-in flows are testable.
Configurable path access
An --allow-unrestricted-paths option shipped in 1.6.0 for setups that need broader filesystem reach.
How you would actually use it.
Concrete setups pulled from the research, not feature-list hand-waving.
The named retainer hunt
Frontend engineer chasing a slow single page app
Ask the agent to snapshot the heap, run the suspect interaction loop, snapshot again, then diff and report the largest growth by object count and total size.
A specific retained object to fix instead of a ticket that says the page gets slow after a while.
Standing perf regression check
Team lead owning web vitals
Make the snapshot diff and performance insight pass a repeated step your agent runs against a staging build whenever a perf-sensitive PR lands.
Memory regressions get caught as part of review rather than discovered by users weeks later.
Authenticated flow debugging
Full stack developer on a gated dashboard
Connect the server to a Chrome session that is already logged in and have the agent inspect console and network output on the pages behind the login wall.
Bug reproduction on real authenticated state without scripting a fake login path.
Duplicate string cleanup
Performance-minded reviewer on a large bundle
Point the agent at the memory tooling and ask it to flag duplicated strings in the snapshot, then trace where they are being generated.
Cheap memory wins that never surface in a normal profiler skim.
Pricing, straight.
Full MCP server from the ChromeDevTools GitHub repo, community support through issues and discussions.
It is a Google-maintained open source MCP server, so the only cost is your setup time; one third-party listing shows a $19.99/month Pro tier, and we found nothing in the repo or docs to support that, so treat it as noise until Google says otherwise.
Pricing as captured on 2026-08-03. Check the live site before you commit.
What people online are saying.
Real reactions surfaced during research. Paraphrased faithfully, linked to source.
Enthusiastic but early: the loudest reactions are Reddit developers thrilled that an agent can finally see Chrome, with the friction complaints centered on setup and connection rather than the tooling itself.
Developers in r/vibecoding called DevTools MCP straight-up magic, mostly because the agent can inspect a live browser instead of guessing from the code.
An r/AugmentCodeAI thread framed it as a real step forward for browser control and debugging, since MCP-compatible tools can now act on Chrome directly.
People in r/mcp are still trading workarounds for basics like auto-connecting the server to an already running Chrome instance.
The active troubleshooting guide and discussion threads suggest plenty of users are still fighting installation and connection issues rather than treating this as polished out of the box.
The field.
MCP server for scripted browser control across engines.
PICK IT WHENYour need is repeatable automation and cross-browser coverage more than DevTools-level inspection.
Thin MCP layers over Puppeteer for page actions and automation.
PICK IT WHENYou want a minimal automation surface and do not need heap, console, or performance depth.
Agentic browsing framework aimed at autonomous web tasks.
PICK IT WHENThe goal is an agent completing tasks on the open web rather than debugging your own app.
The honest part.
- The official troubleshooting docs advise against using it with browser instances running hundreds of tabs, which rules out your daily driver Chrome.
- Chrome-first by design; support for non-Chrome browsers is limited.
- Advanced automation still expects JavaScript fluency, so it is not a no-code debugging layer.
- Snapshot output is large enough that the project keeps shipping aggregation and filtering to make it agent-readable, so expect context pressure on big heaps.
- Fast-moving releases: 1.5.0 documentation is already behind 1.6.0, so treat guides and blog posts as dated quickly.
Getting started.
Time to first value: about 20 minutes if the MCP connection cooperates
Add the chrome-devtools-mcp server to your MCP client config in Claude Code, Codex, or your agent of choice, pinning the latest release rather than 1.5.0.
Start or attach to a Chrome instance with a small number of tabs, ideally just the page you are debugging.
Ask the agent for a heap snapshot, run the suspect interaction, snapshot again, and request the diff with object counts and sizes.
Quick answers.
Is there really a paid Pro plan?
Nothing in the repo, changelog, or Chrome developer docs points to one. The project lives as an open source MCP server under the ChromeDevTools GitHub org; a third-party listing shows a $19.99/month Pro tier, and we could not verify it anywhere official.
Should I install 1.5.0 specifically for the memory tools?
No. Memory analysis landed in 1.5.0, but 1.6.0 shipped on 2026-07-14 and extended it with object counts and total sizes in get_heapsnapshot_details plus filtering on snapshot aggregates. Pin the newest release and you get the memory workflow plus the readability improvements.
Can it debug pages behind a login?
Yes, and that is one of its selling points. Google's launch posts highlight reusing an existing authenticated Chrome session so agents can inspect real logged-in pages. Just be deliberate about which session you hand an agent.
How does it compare to Playwright MCP?
Playwright MCP is the closest peer, but it is centered on scripted browser control while this is centered on DevTools-level inspection: console, network, performance, and now heap analysis. If you need cross-browser automation pick Playwright; if you need to find out why the page leaks, pick this one.
Wire it into your agent config once and make the snapshot diff a standing step in performance regressions. The setup friction is real, the payoff on leak hunts is worth it.
Field research: 1 pages scraped · 3 search passes · 12 community sources. Reviewed by the Koda desk on 2026-08-03.