Coding
Free, open source on GitHub
about 20 minutes if the MCP connection cooperates
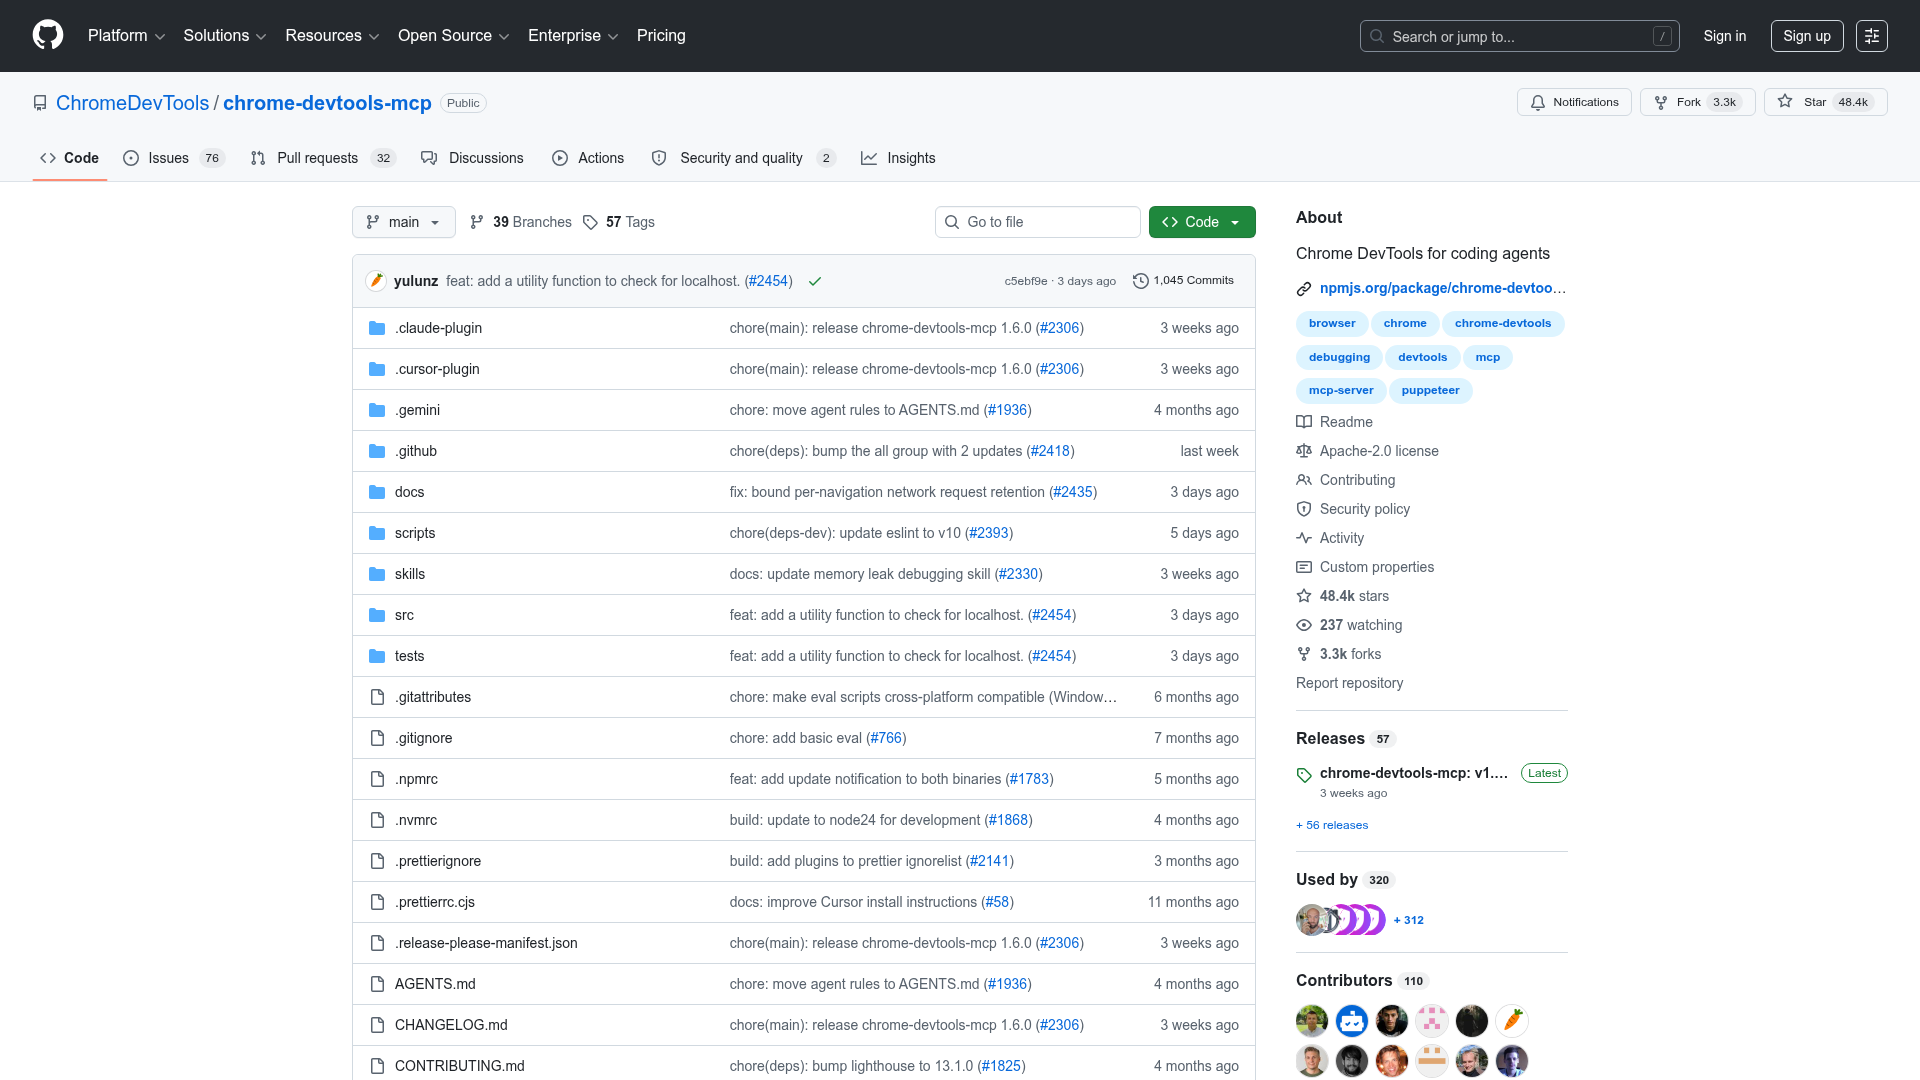
Your agent can now take two heap snapshots, diff them, and name the object that is eating the tab, without you ever opening a profiler.
This is for developers already running Claude Code, Codex, or another MCP client who are tired of agents guessing about runtime behavior from source code alone. The 1.5.0 memory tooling, extended in 1.6.0 with object counts, total sizes, and snapshot filtering, turns a vague slowdown report into a named retainer, which is the single hardest handoff to automate. Adopt it if you own web performance; it is free, it is Google's own, and the alternative is you in a profiler tab.
Capability 8.4
Ease 6.4
Value 9.2
Momentum 8.8
“Developers in r/vibecoding called DevTools MCP straight-up magic, mostly because the agent can inspect a live browser instead of guessing from the code.”Reddit r/vibecoding